I was recently challenged to wireframe a piece of data analysis software as part of a job application. With a very tight deadline and zero experience using data analysis software, I spent an action-packed two days subjecting data-savvy friends to interviews, downloading free trials of software like Tableau, sketching, and working up a prototype in Illustrator. Here’s the brief, and here’s what I created.
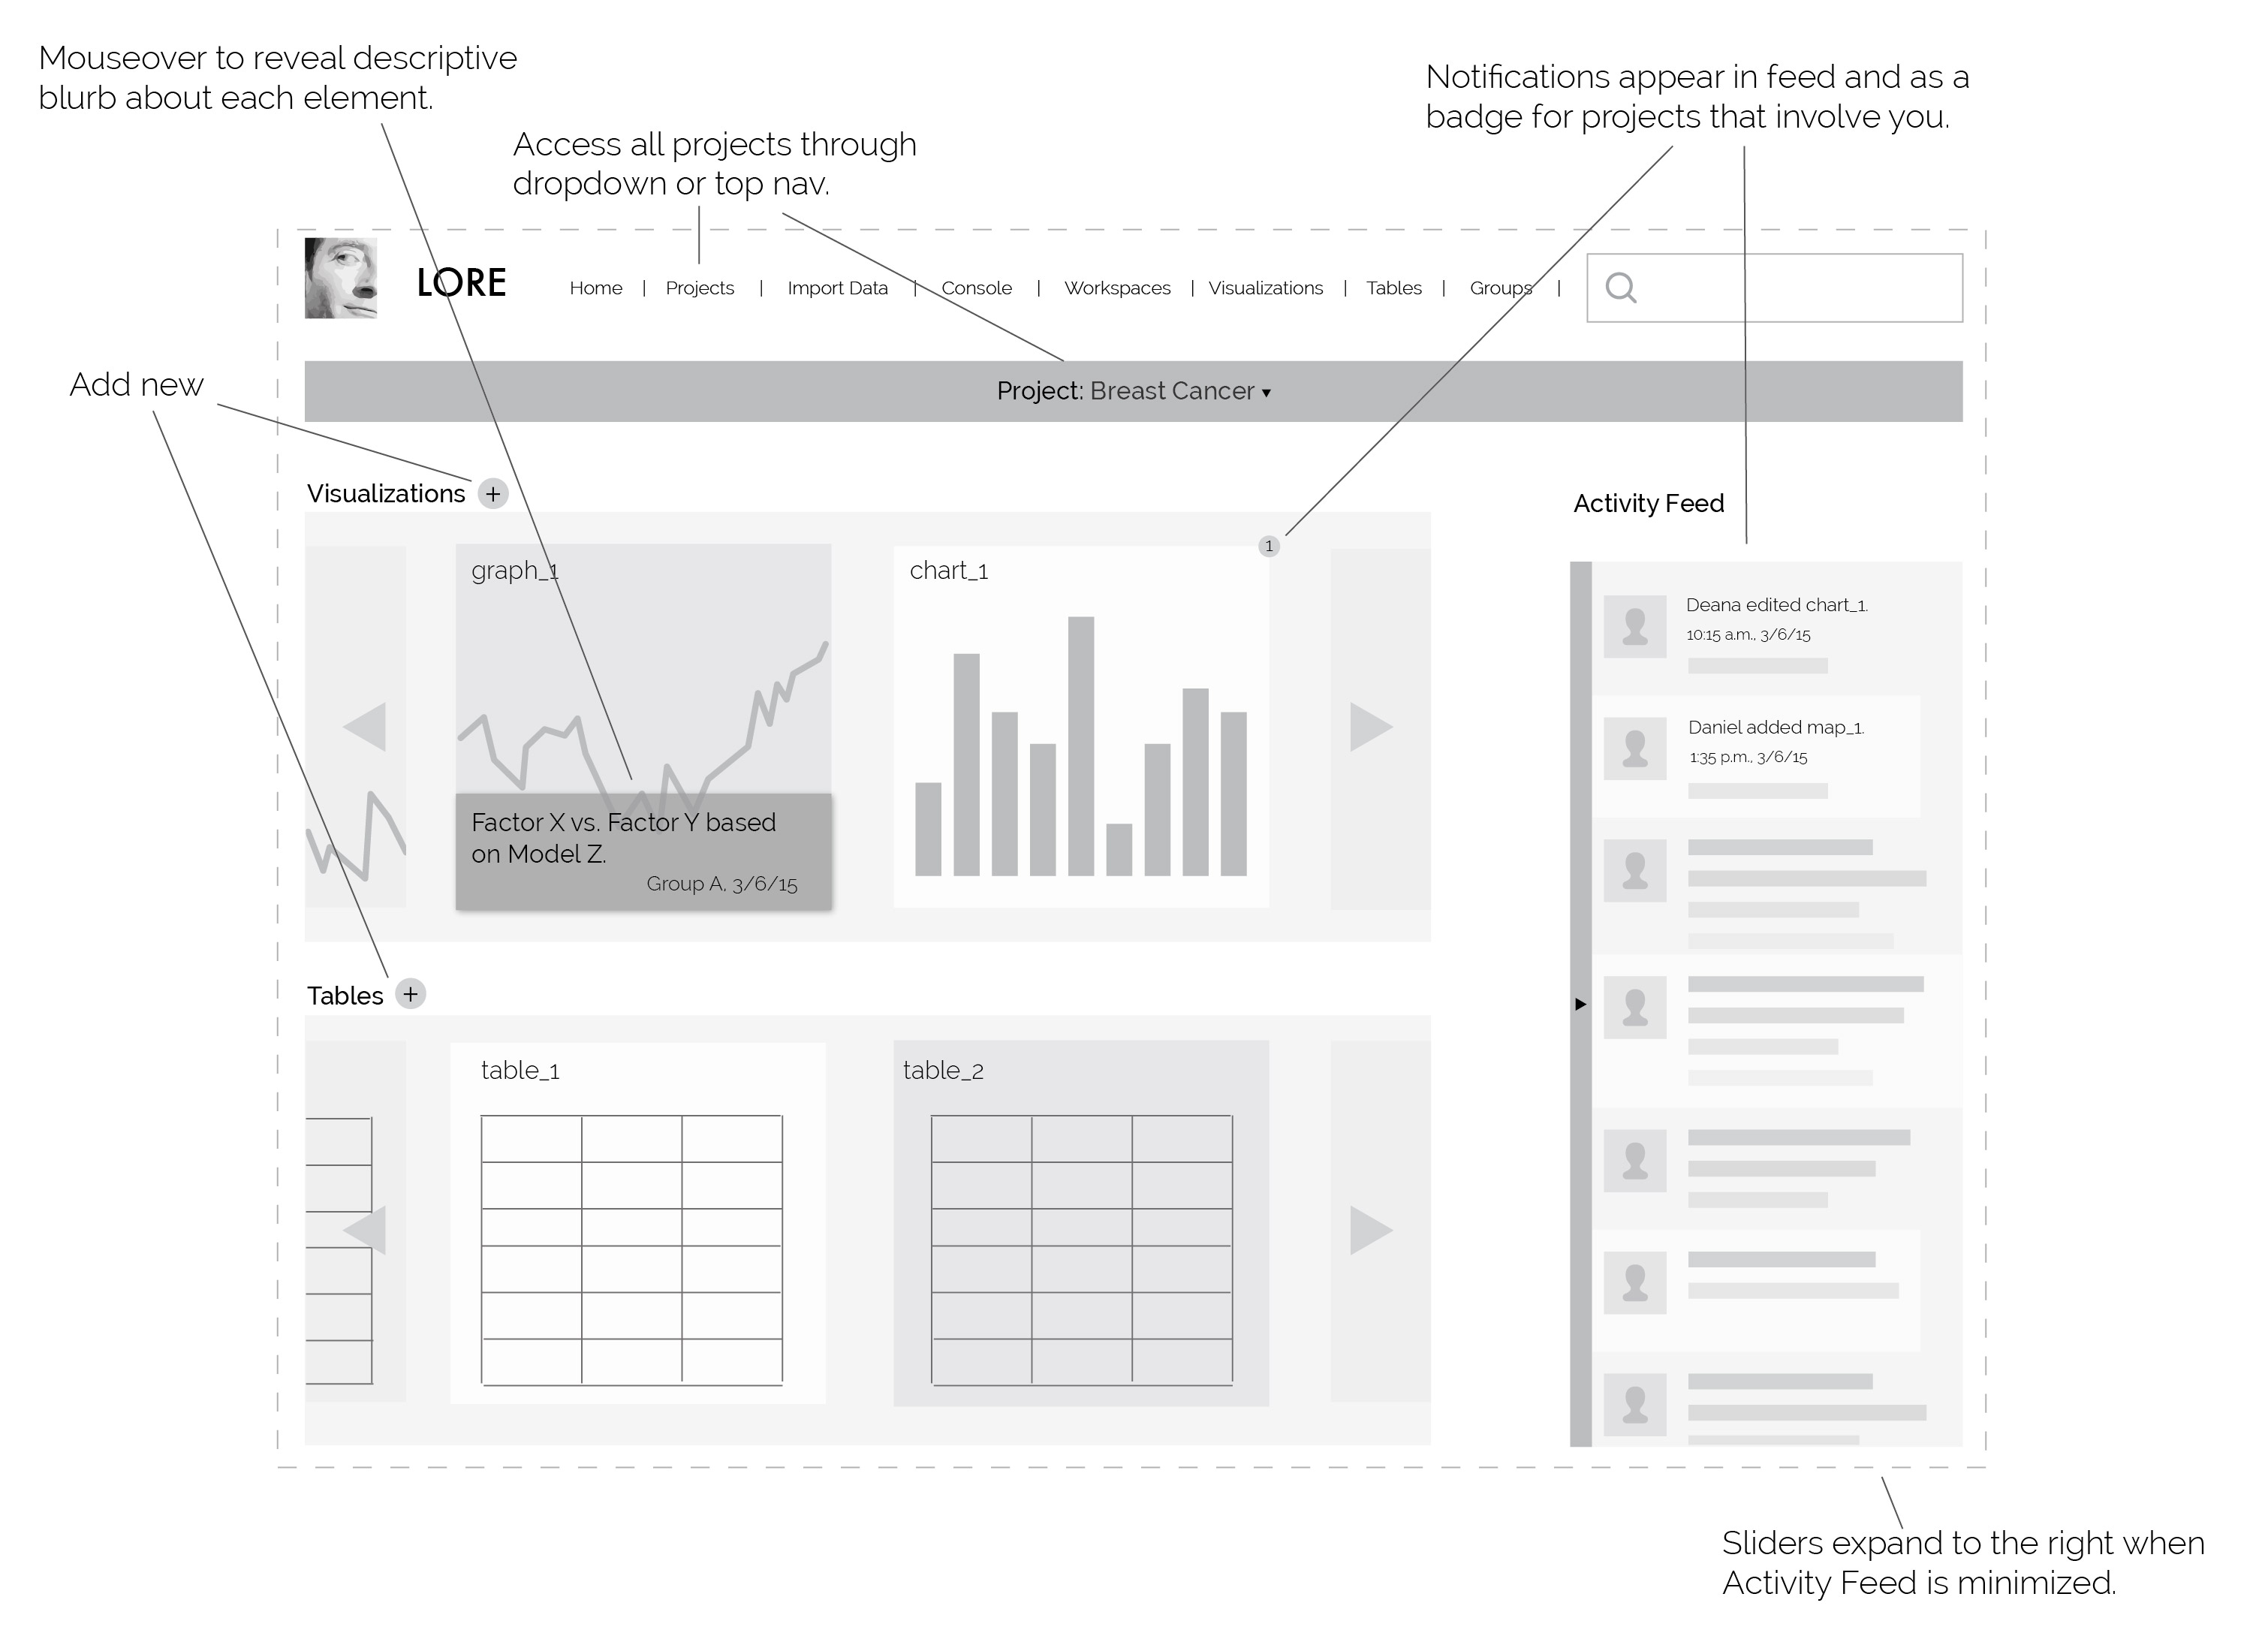
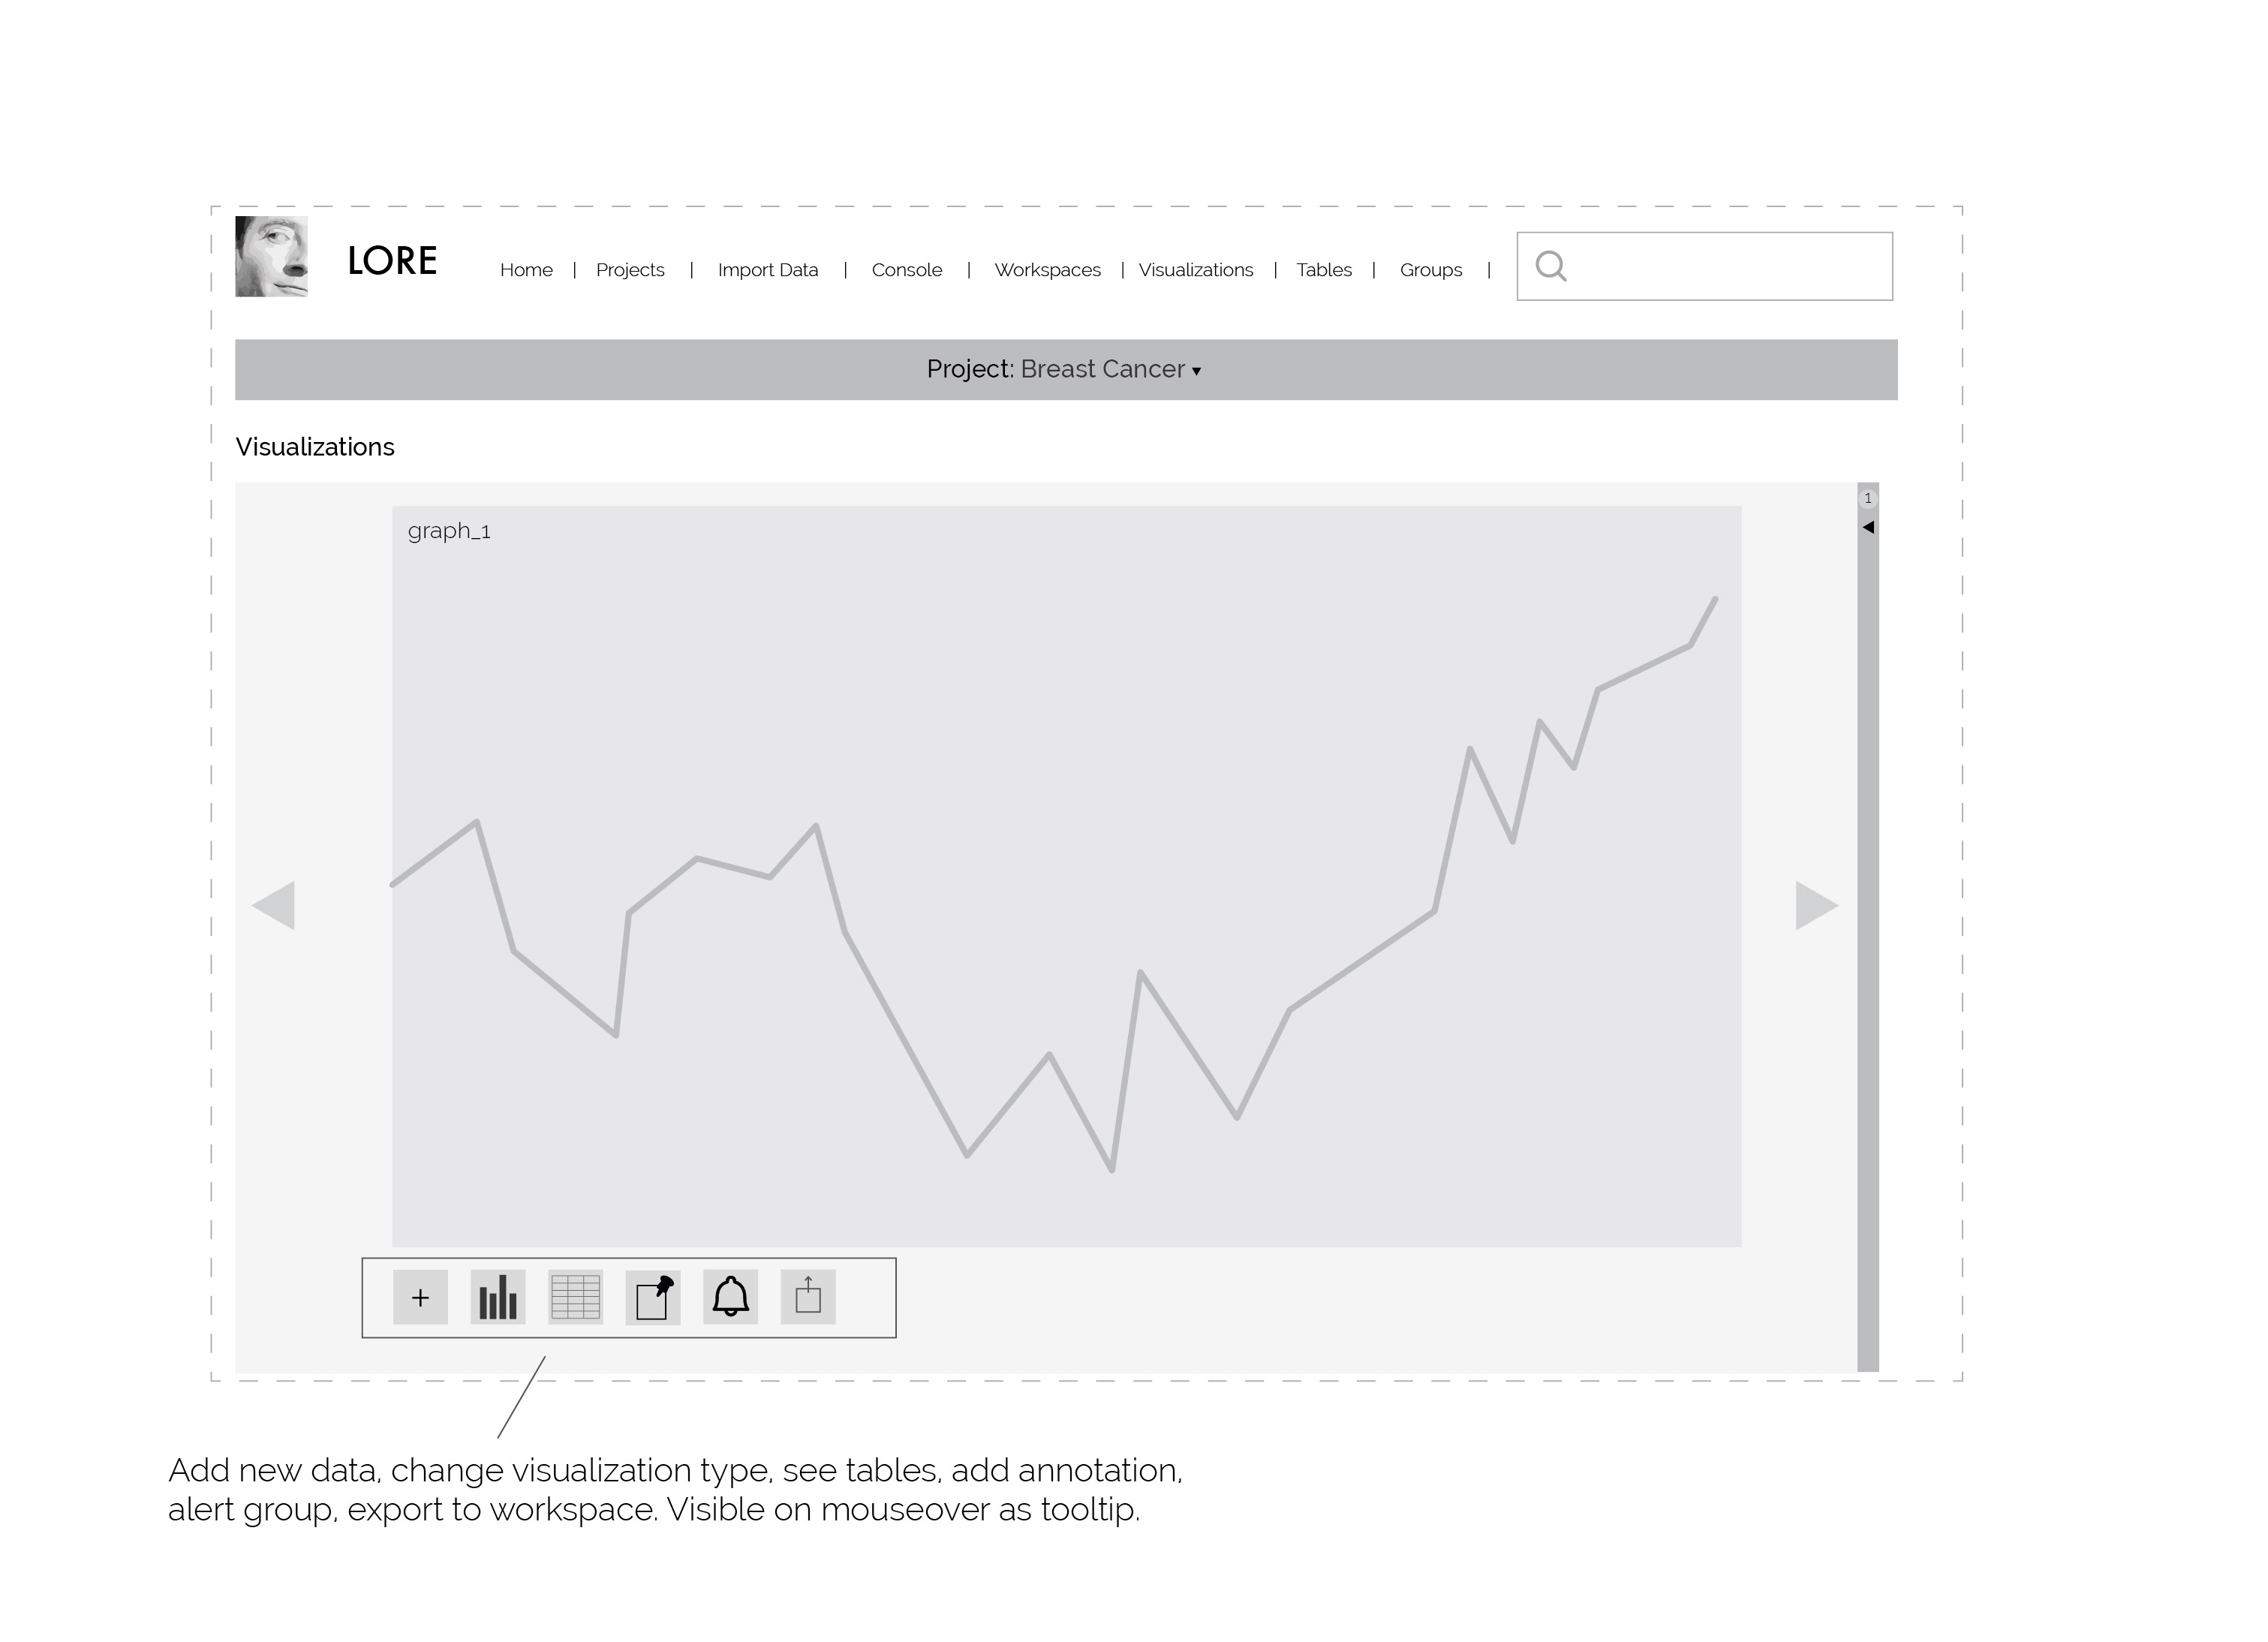
The brief required me to wireframe a dashboard incorporating streams of data science projects, data visualizations, tables, and a news feed with notification. I also needed to include navigation and a wireframe for one of the sub-pages from the dashboard; either projects, visualizations, or tables. I asked some questions about typical user flow both to the interviewer and to my knowledgeable friends, which led me to add some goals about team collaboration, data manipulation, and sharing final products with a supervisor to my brief.
Here are my dashboard and visualizations pages.
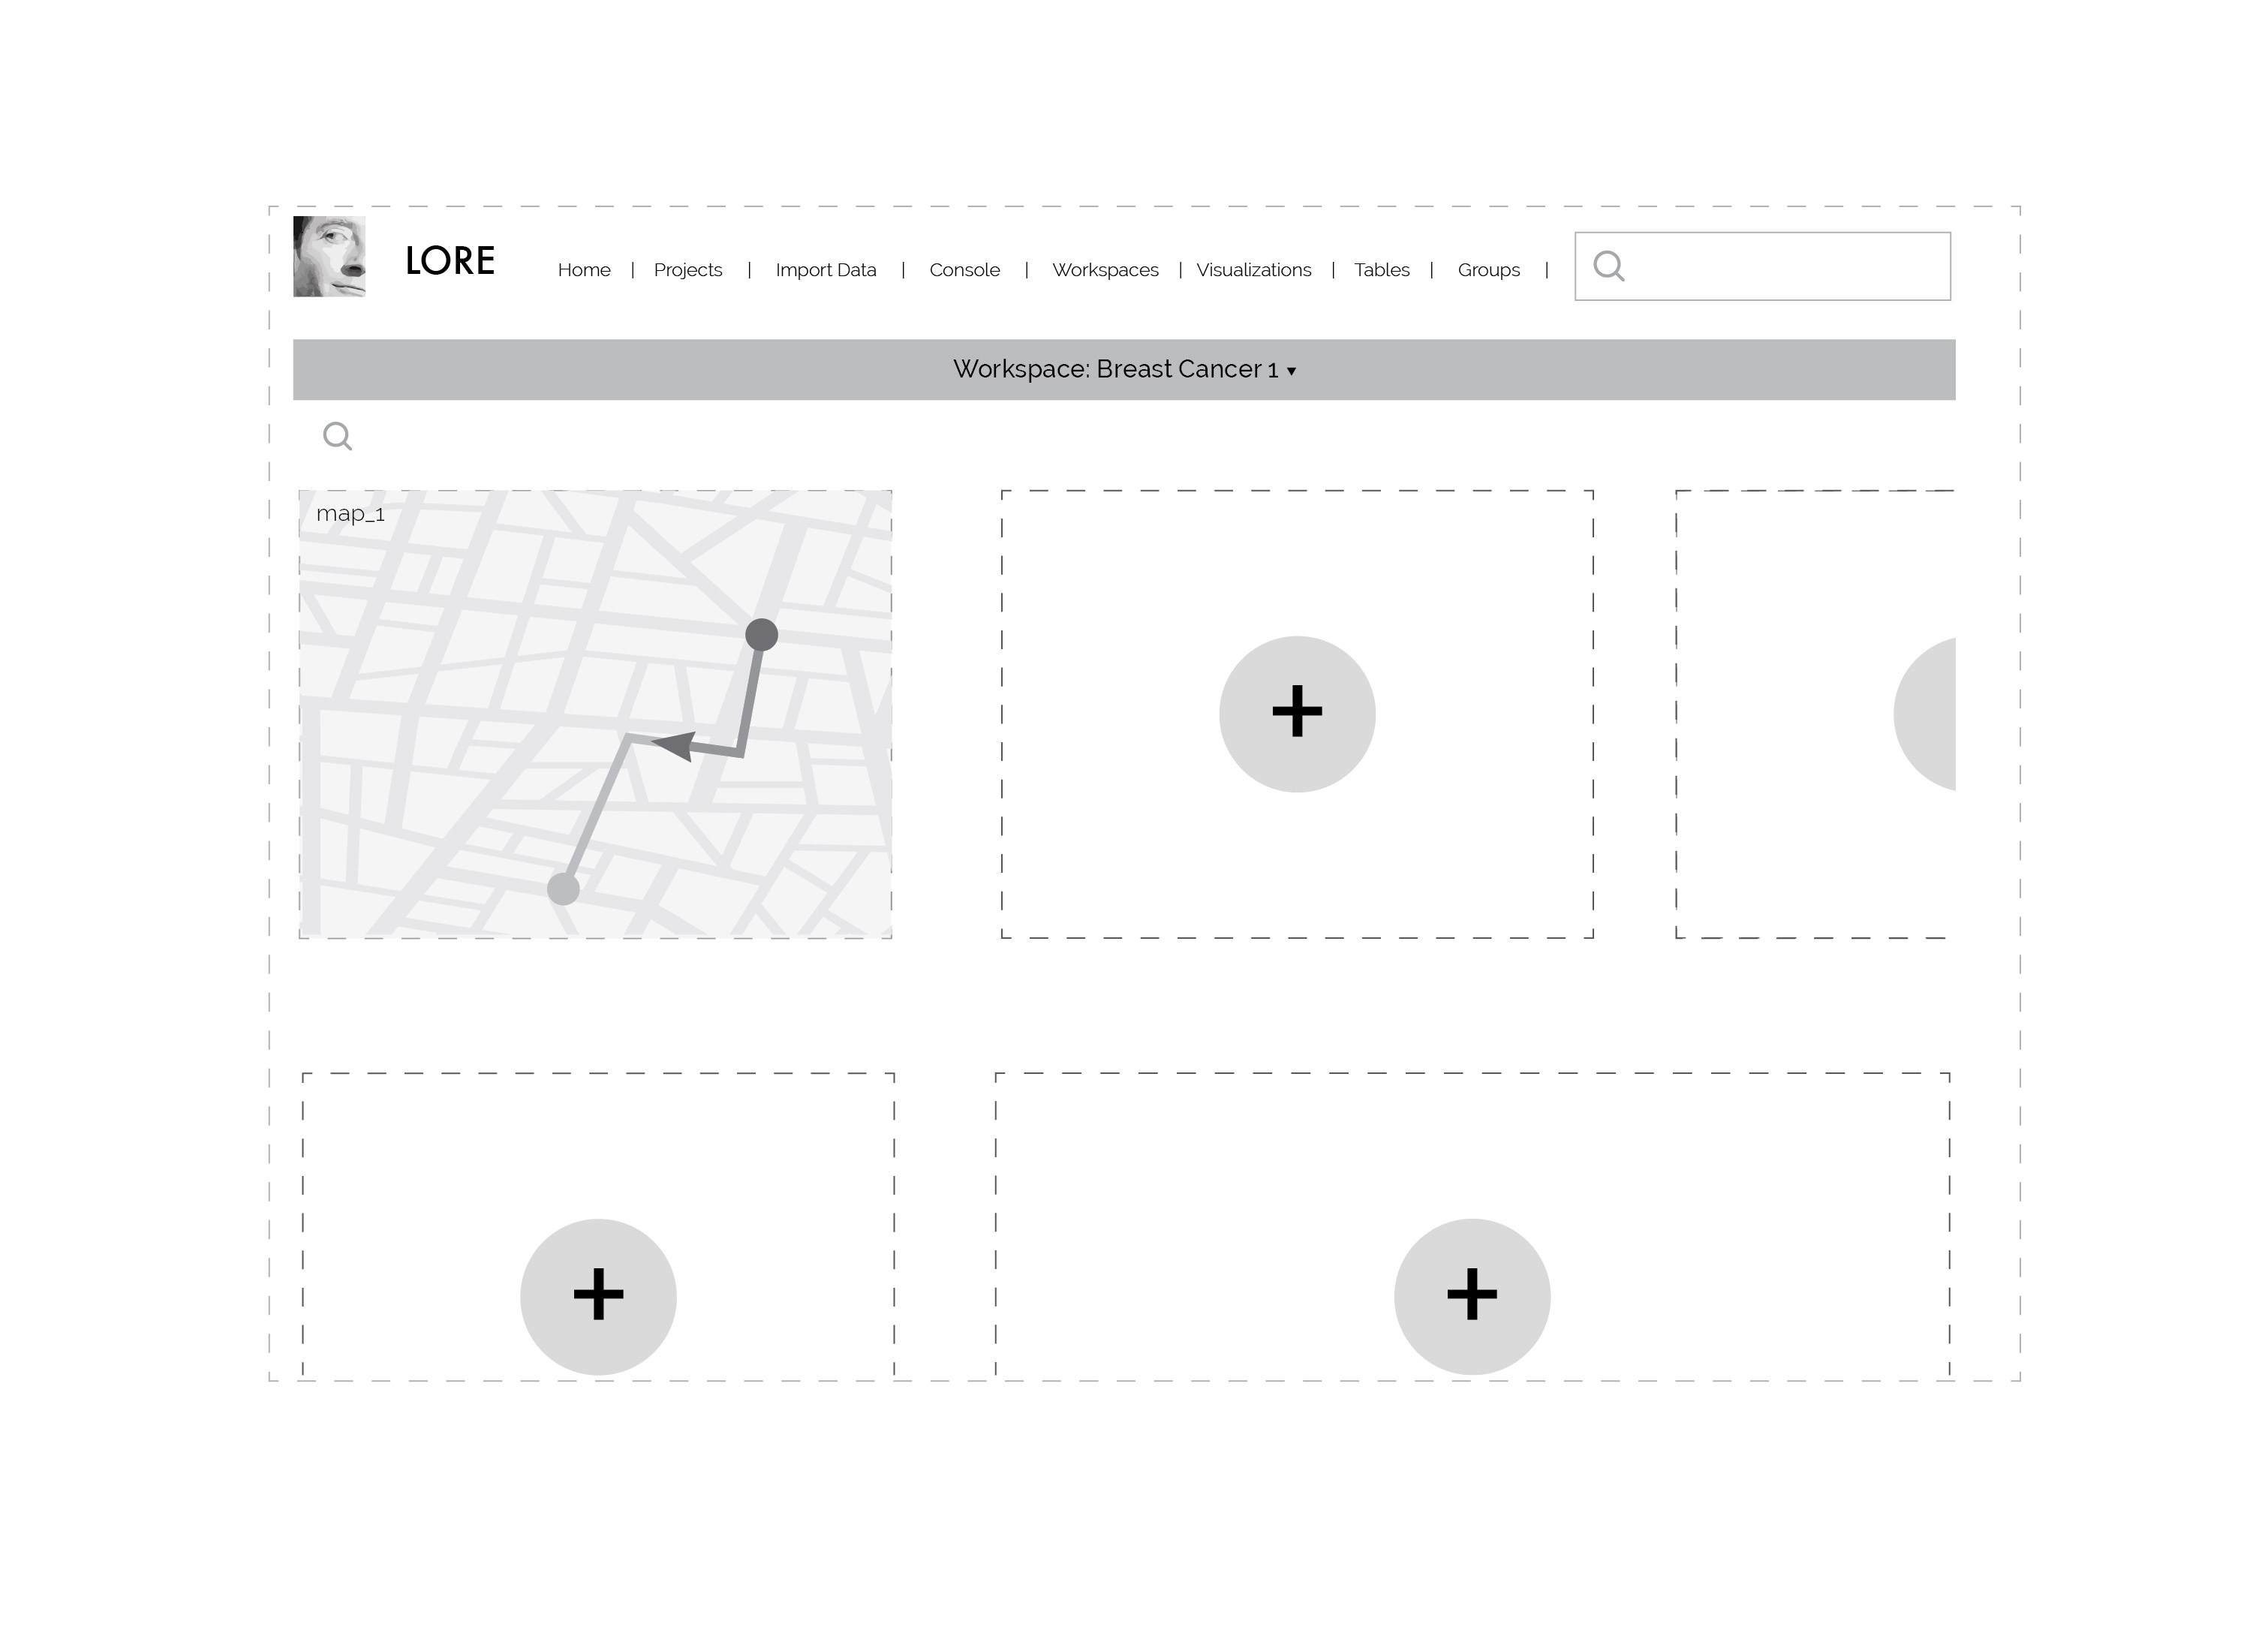
 Based on the rapid-fire user interviews I did to prepare for this project, I also thought it would be useful to create a “workspace”, a place where different types of data and visualizations can be dragged around, annotated, contextualized, and exported to show other other people on the team. This part wasn’t in the scope, so it’s still a work in progress:
I was also slightly disappointed that nobody commented on my awesome Star Trek joke in the upper left corner, but I think I still want the job.